

Reliability data analysis of EMU pantograph
-
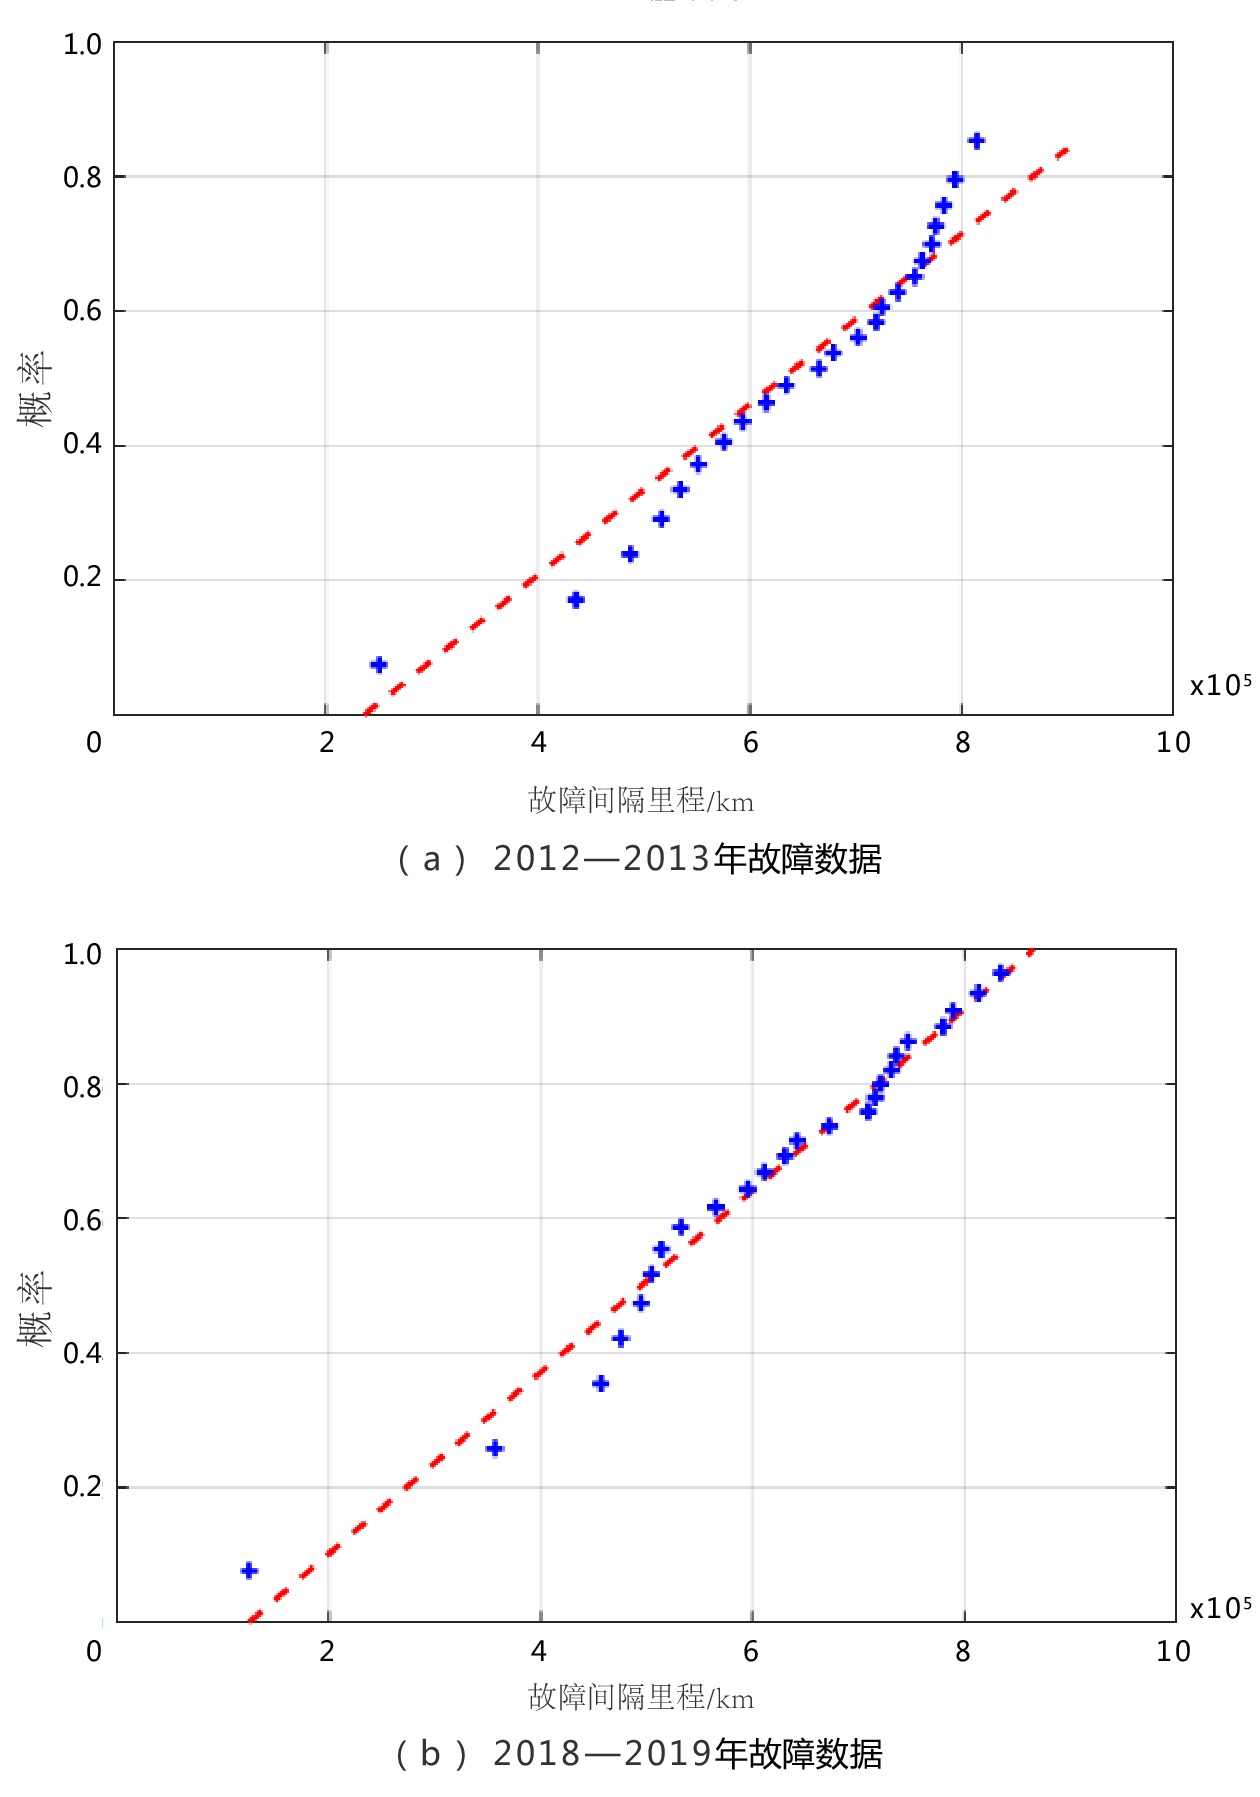
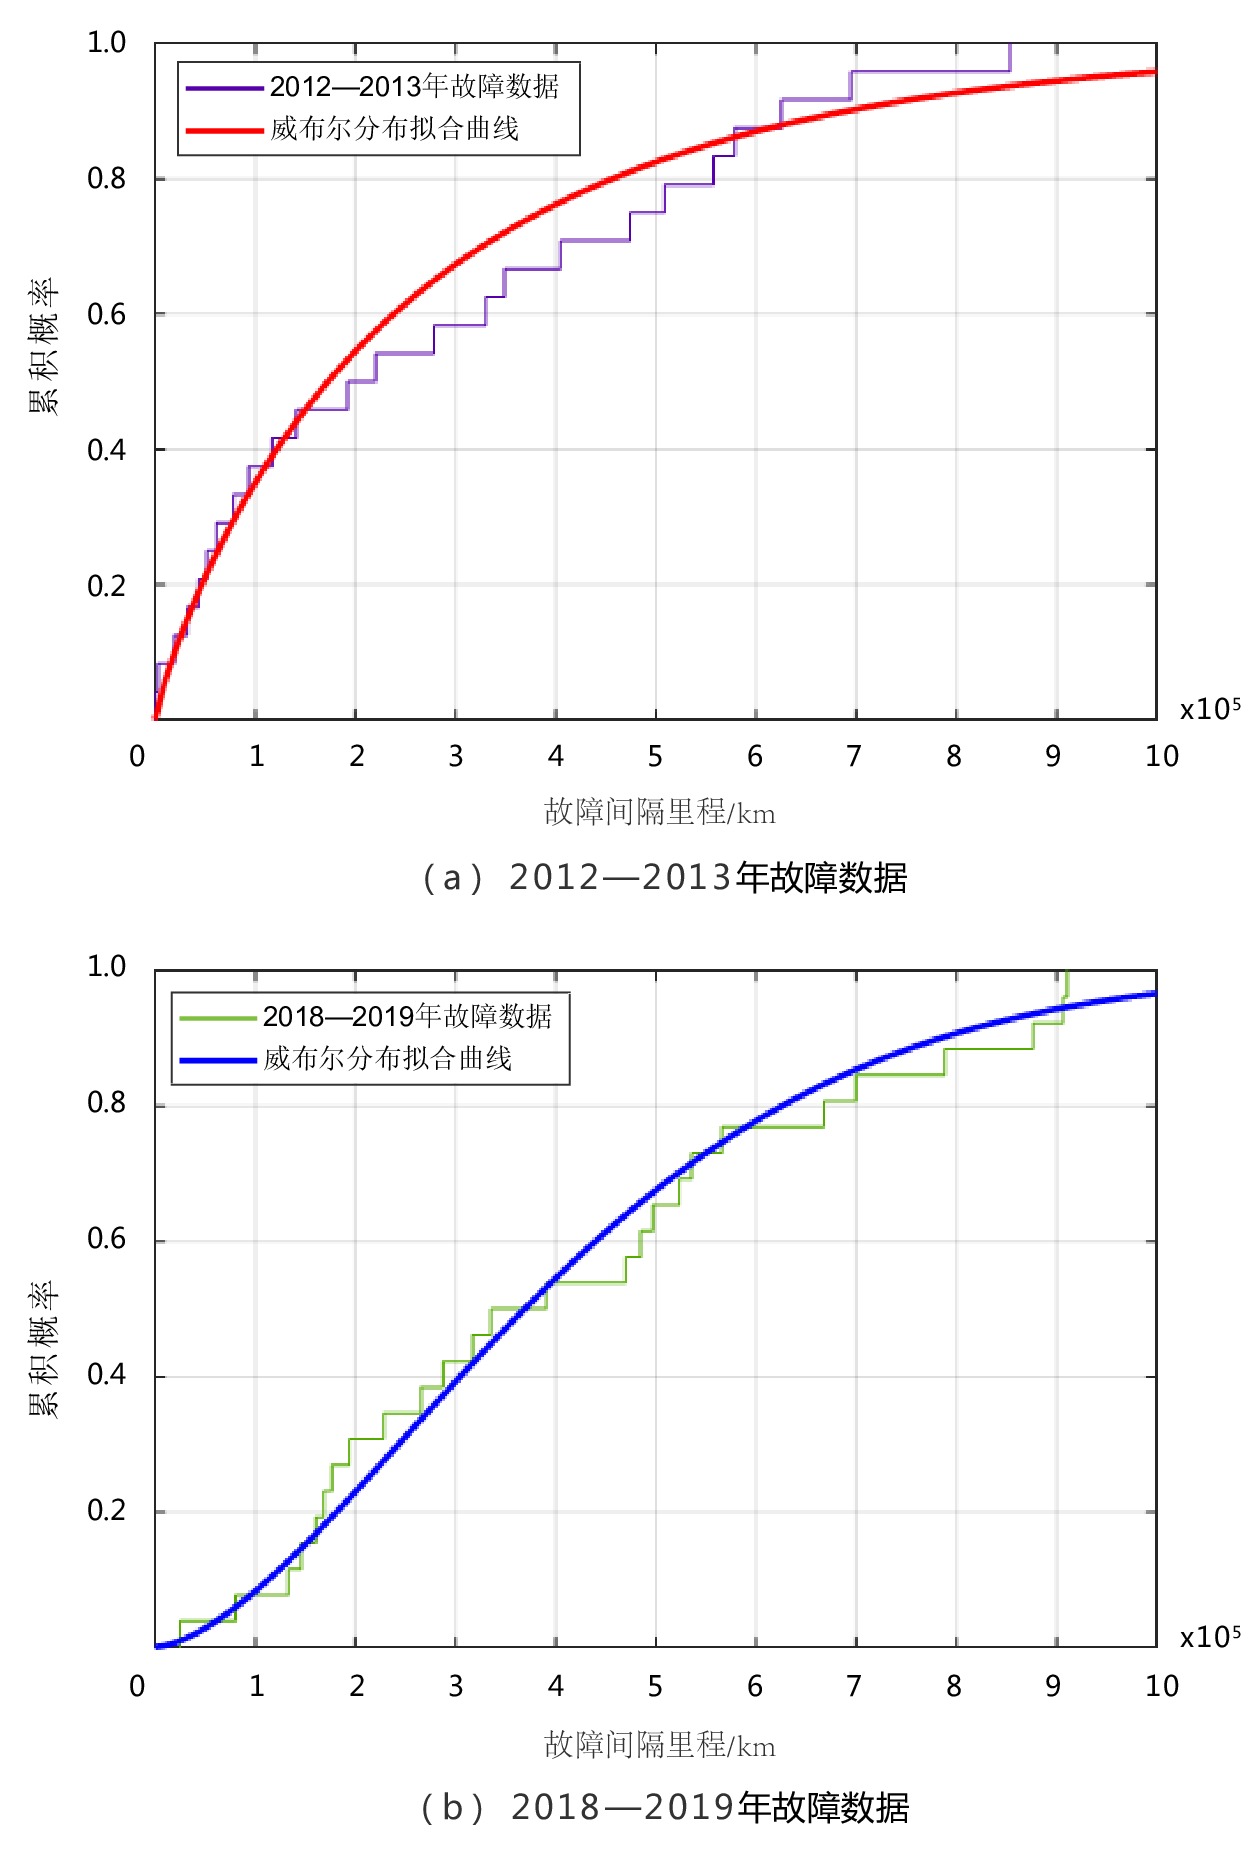
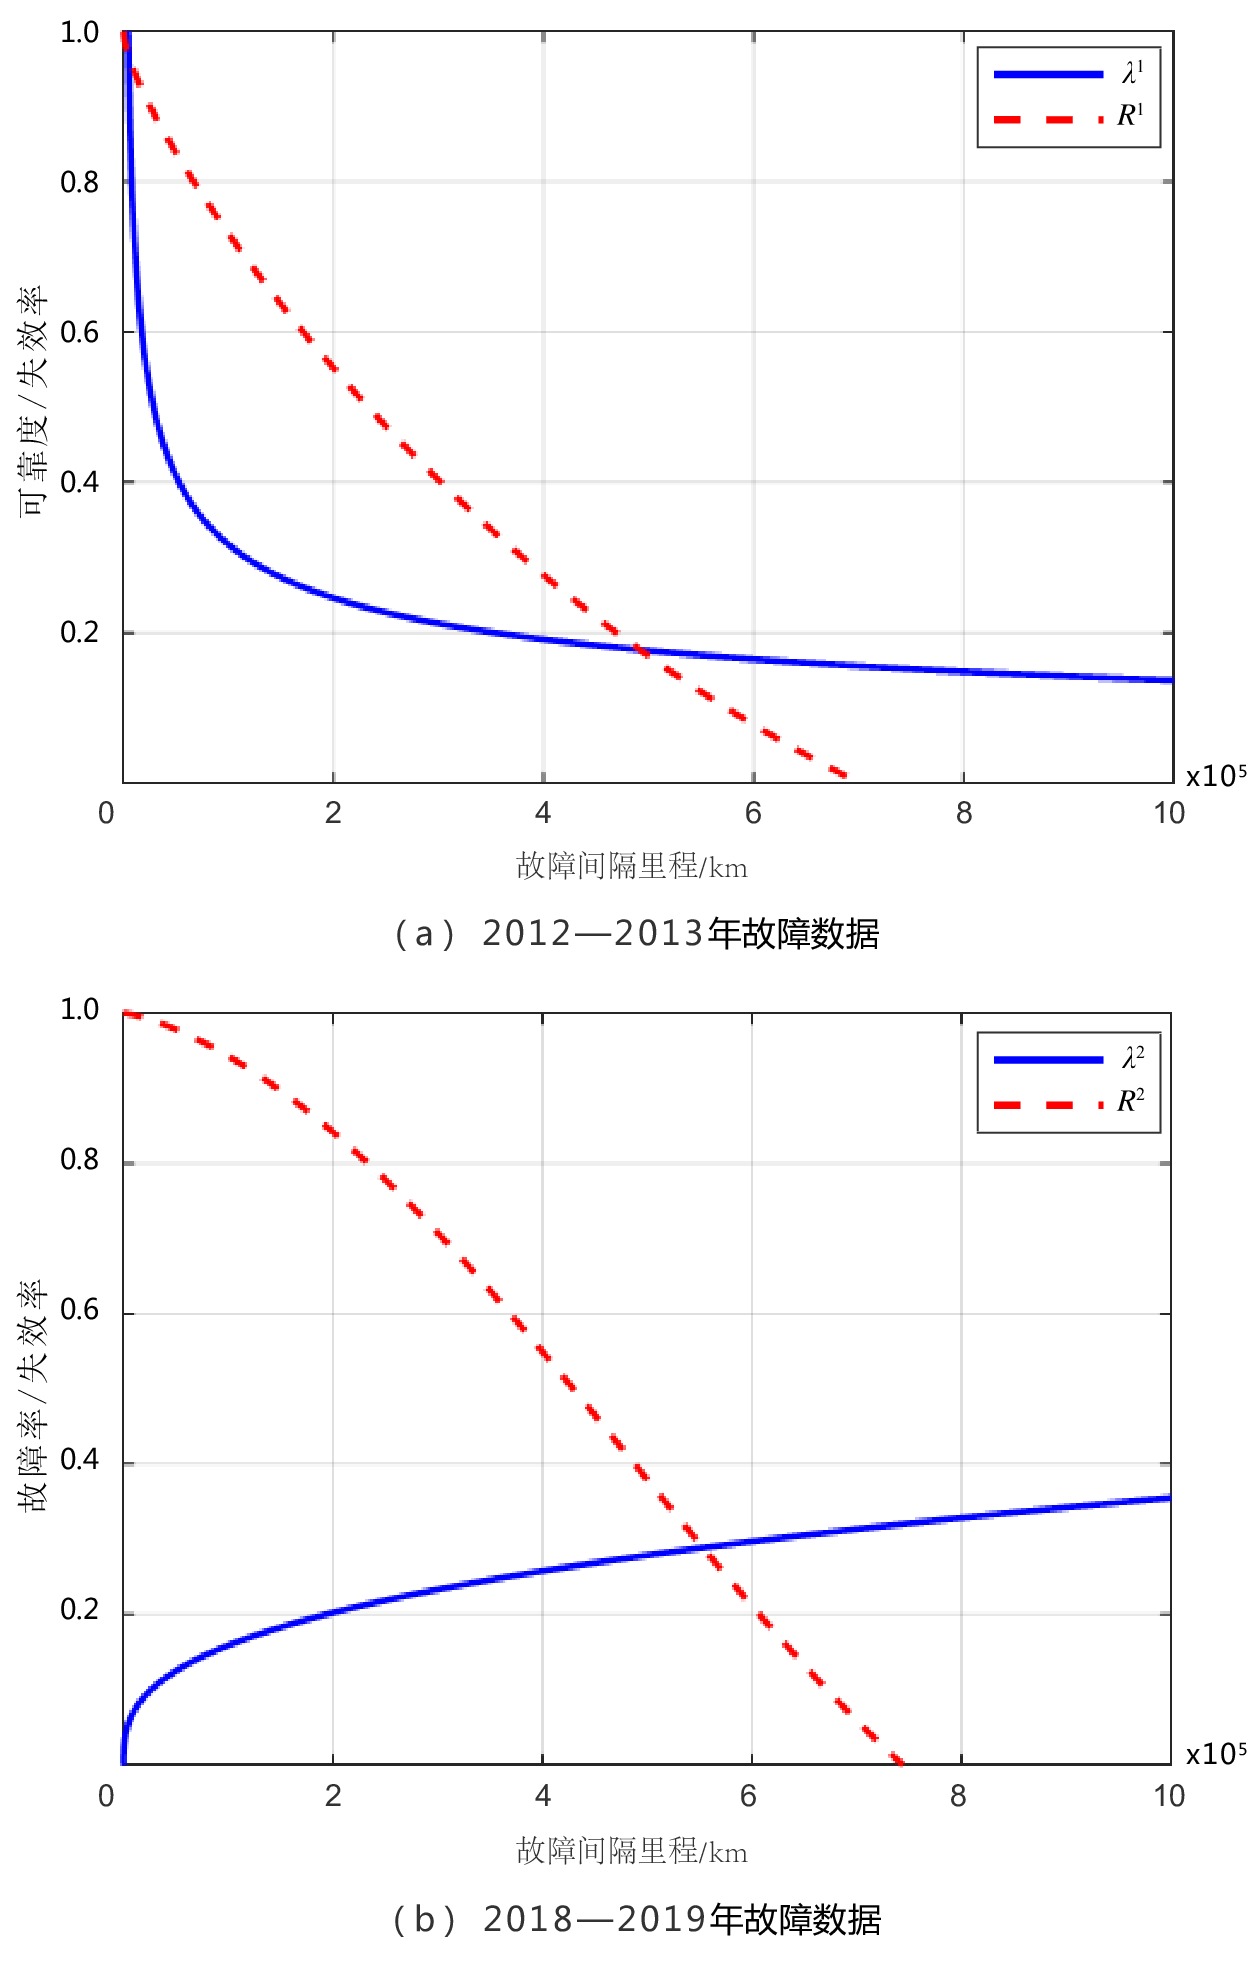
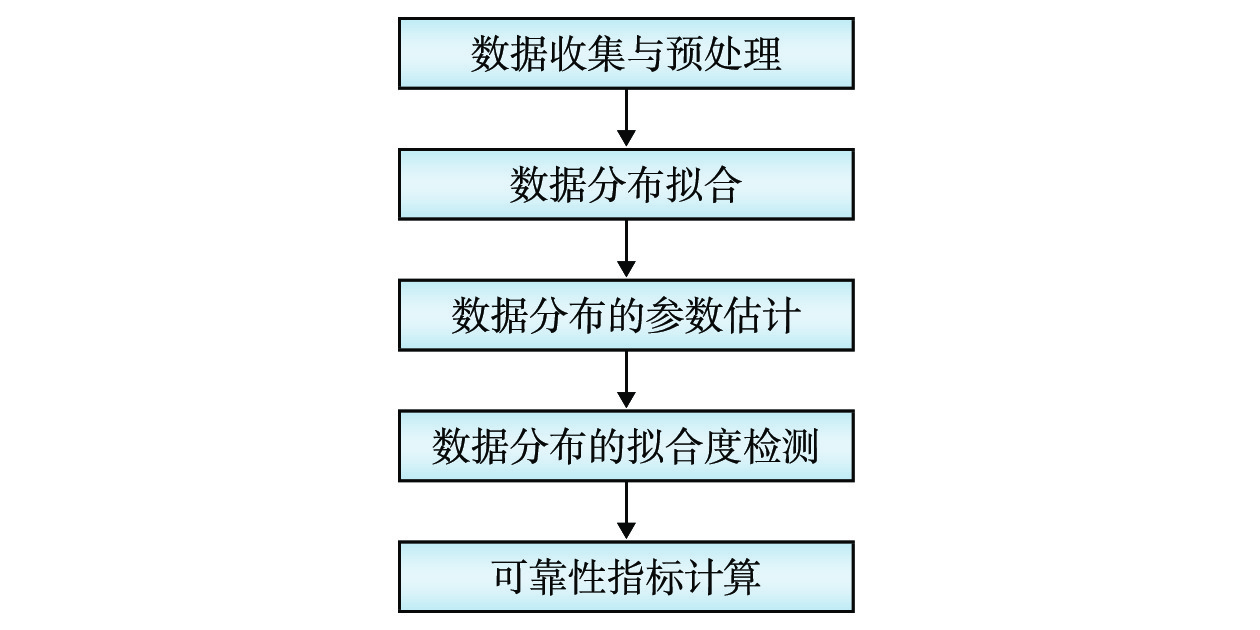
摘要: 为研究动车组受电弓在不同运营阶段的故障分布规律,文章以CRH3型动车组受电弓在不同运行阶段的两组故障数据为基础,运用最小二乘法分析故障数据的分布规律。计算结果表明,动车组受电弓故障数据服从威布尔分布;动车组受电弓在早期运营阶段故障率高,后期运营阶段故障率逐渐降低。本文的分析结果可以为不同运营阶段的动车组检修与故障预测提供理论依据。Abstract: In order to study the fault distribution law of EMU pantograph in different operation stages, based on the fault data of CRH3 EMU pantograph in two different operation stages, this paper analyzed the fault distribution law with the least square estimation method. The calculation results show that the pantograph fault data of EMU obey Weibull distribution, in the early operation stage, the failure rate is high and the failure occurs frequently, and the failure rate decreases gradually in the later operation stage. By using the method of reliability data analysis, the fault distribution in different stages can provide theoretical basis for the maintenance and fault prediction of EMU running on line at different times.
-
Keywords:
- pantograph /
- EMU /
- reliability /
- Weibull distribution /
- least square method /
- data analysis
-
-
表 1 某高铁线受电弓故障数据及其中位秩(2012—2013年)
数据样本
排序序号ti / km F(ti) 数据样本排序
序号ti / km F(ti) 1 0.004 43×105 0.028 7 13 2.202 03×105 0.520 5 2 0.030 26×105 0.069 7 14 2.785 99×105 0.561 5 3 0.193 72×105 0.110 7 15 3.302 06×105 0.602 5 4 0.324 25×105 0.151 6 16 3.488 73×105 0.643 4 5 0.434 29×105 0.192 6 17 4.049 05×105 0.684 4 6 0.519 57×105 0.233 6 18 4.745 61×105 0.725 4 7 0.615 65×105 0.274 6 19 5.087 07×105 0.766 4 8 0.783 88×105 0.315 6 20 5.57580×10⁵ 0.807 4 9 0.935 82×105 0.356 6 21 5.788 73×105 0.848 4 10 1.170 36×105 0.397 5 22 6.252 37×105 0.889 3 11 1.413 05×105 0.438 5 23 6.949 04×105 0.930 3 12 1.921 94×105 0.479 5 24 8.534 10×105 0.971 3  下载: 导出CSV
表 2 某高铁线受电弓故障数据及其中位秩(2018—2019年)
数据样本排序序号 ti / km F(ti) 数据样本排序序号 ti / km F(ti) 1 0.252 58×105 0.026 5 13 3.354 25×105 0.481 1 2 0.805 68×105 0.064 4 14 3.905 84×105 0.518 9 3 1.328 62×105 0.102 3 15 4.695 72×105 0.556 8 4 1.459 80×105 0.140 2 16 4.850 14×105 0.594 7 5 1.605 62×105 0.178 0 17 4.969 63×105 0.632 6 6 1.686 80×105 0.215 9 18 5.232 88×105 0.670 5 7 1.767 50×105 0.253 8 19 5.355 82×105 0.708 3 8 1.936 87×105 0.291 7 20 5.658 96×105 0.746 2 9 2.285 69×105 0.329 5 21 6.680 24×105 0.784 1 10 2.656 92×105 0.367 4 22 6.998 52×105 0.822 0 11 2.875 04×105 0.405 3 23 7.885 48×105 0.859 8 12 3.168 57×105 0.443 2 24 8.768 60×105 0.897 7
下载: 导出CSV
表 3 某高铁线受电弓故障数据计算结果(2012—2013年)
数据样本排序序号 ti / km xi yi 数据样本排序序号 ti / km xi yi 1 0.004 43×105 −5.419 4 −3.536 7 13 2.202 03×105 0.789 4 −0.307 9 2 0.030 26×105 −3.497 9 −2.628 1 14 2.785 99×105 1.024 6 −0.193 2 3 0.193 72×105 −1.641 3 −2.143 3 15 3.302 06×105 1.194 5 −0.080 7 4 0.324 25×105 −1.126 2 −1.805 2 16 3.488 73×105 1.249 5 0.030 8 5 0.434 29×105 −0.834 0 −1.541 9 17 4.049 05×105 1.398 5 0.142 7 6 0.519 57×105 −0.654 8 −1.324 0 18 4.745 61×105 1.557 2 0.256 6 7 0.615 65×105 −0.485 1 −1.136 3 19 5.087 07×105 1.626 7 0.374 4 8 0.783 88×105 −0.243 5 −0.969 8 20 5.57580×10⁵ 1.718 4 0.499 0 9 0.935 82×105 −0.066 3 −0.818 9 21 5.788 73×105 1.755 9 0.634 6 10 1.170 36×105 0.157 3 −0.679 8 22 6.252 37×105 1.833 0 0.789 1 11 1.413 05×105 0.345 8 −0.549 6 23 6.949 04×105 1.938 6 0.979 8 12 1.921 94×105 0.653 3 −0.426 2 24 8.534 10×105 2.144 1 1.267 3 平均值 ${ {\bar {x} }_1}$=0.225 8, ${ {\bar {y} }_1}$=−0.548 6
下载: 导出CSV
表 4 某高铁线受电弓故障数据计算结果(2018—2019年)
数据样本排序序号 ti / km xi yi 数据样本排序序号 ti / km xi yi 1 0.252 58×105 −1.376 0 −3.616 6 13 3.354 25×105 1.210 2 −0.421 6 2 0.805 68×105 −0.216 1 −2.709 6 14 3.905 84×105 1.362 5 −0.312 3 3 1.328 62×105 0.284 1 −2.226 7 15 4.695 72×105 1.546 7 −0.206 1 4 1.459 80×105 0.378 3 −1.890 5 16 4.850 14×105 1.579 −0.101 9 5 1.605 62×105 0.473 5 −1.629 4 17 4.969 63×105 1.603 3 0.001 2 6 1.686 80×105 0.522 8 −1.413 7 18 5.232 88×105 1.655 0 0.104 4 7 1.767 50×105 0.569 6 −1.228 5 19 5.355 82×105 1.678 2 0.208 8 8 1.936 87×105 0.661 1 −1.064 7 20 5.658 96×105 1.733 2 0.315 7 9 2.285 69×105 0.826 7 −0.916 8 21 6.680 24×105 1.899 2 0.427 2 10 2.656 92×105 0.977 2 −0.781 0 22 6.998 52×105 1.945 7 0.545 7 11 2.875 04×105 1.056 1 −0.654 5 23 7.885 48×105 2.065 0 0.675 5 12 3.168 57×105 1.153 3 −0.535 3 24 8.768 60×105 2.171 2 0.824 2 平均值 $ {\bar x_2} $=1.073 3, $ {\bar y_2} $=−0.691 9
下载: 导出CSV
-
[1] 孙有朝, 张永进. 可靠性原理与方法[M]. 北京: 科学出版社, 2016: 21-24. [2] 刘诗佳. 动车组牵引系统故障统计分析 [J]. 铁道机车车辆,2013,33(5):80-85. DOI: 10.3969/j.issn.1008-7842.2013.05.20 [3] 王 韬. 基于贝叶斯网络的动车组牵引传动系统可靠性分析[D]. 成都: 西南交通大学, 2015. [4] 崔秀国. CRH3型动车组电气系统可靠性研究[D]. 北京: 北京交通大学, 2013. [5] 刘建强,崔秀国,孙帮成,等. CRH_3型动车组高压电器系统可靠性研究 [J]. 铁道学报,2013,35(6):22-27. DOI: 10.3969/j.issn.1001-8360.2013.06.004 [6] 董超跃. 基于动态贝叶斯网络的动车组牵引传动系统可靠性分析[D]. 北京: 北京交通大学, 2020. [7] 徐 慧. 动态不确定环境下流程制造企业设备维修计划研究[D]. 上海: 上海交通大学, 2009. [8] 李兴运,齐金平. 基于T-S模糊故障树的受电弓系统可靠性分析 [J]. 安全与环境学报,2018,18(1):33-38. [9] 顾 瑛. 可靠性工程数学[M]. 北京: 电子工业出版社, 2004: 98-109. [10] 赵 宇. 可靠性数据分析教程[M]. 北京: 北京航空航天大学出版社, 2009: 91-93. [11] 金良琼. 两参数Weibull分布的参数估计[D]. 昆明: 云南大学, 2010. [12] 伍建军,吴小明,谢周伟,等. 改进威布尔分布的矿冶零部件可靠性寿命预测研究 [J]. 机械科学与技术,2017,36(3):436-441. [13] 王文岳,崔 杰. 威布尔分布分析及其在产品寿命分析中的应用 [J]. 电子产品可靠性与环境试验,2019,37(5):16-26. DOI: 10.3969/j.issn.1672-5468.2019.05.003 [14] 王平永,刘宏昭,蒋 喜,等. 高速铣削电主轴可靠性试验载荷谱的研究 [J]. 机械科学与技术,2013,32(2):279-284. [15] 刘勇军,杨 勇,范晋伟. 数控磨床液压系统可靠性建模与评估 [J]. 液压与气动,2016(9):16-20. DOI: 10.11832/j.issn.1000-4858.2016.09.003 -
期刊类型引用(3)
1. 沈希臻,陈儒敏. 基于改进YOLOv3的病虫害识别算法研究. 智能计算机与应用. 2025(02): 85-90 .  百度学术
百度学术
2. 刘励耘,许孝梅. 基于图注意力网络与聚类的用户画像研究. 云南电力技术. 2025(01): 68-75+85 . 百度学术
3. 曾亚,孙亚琴. 基于SOM神经网络的网络舆情信息分类方法研究. 长江信息通信. 2025(03): 153-155 . 百度学术
其他类型引用(0)
计量
- 文章访问数: 144
- HTML全文浏览量: 97
- PDF下载量: 22
- 被引次数: 3
